
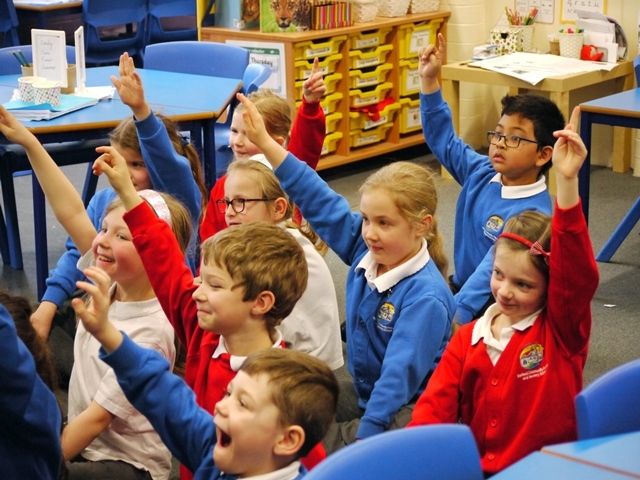
"Pupils make good progress across all year groups in school."
Ofsted, May 2019

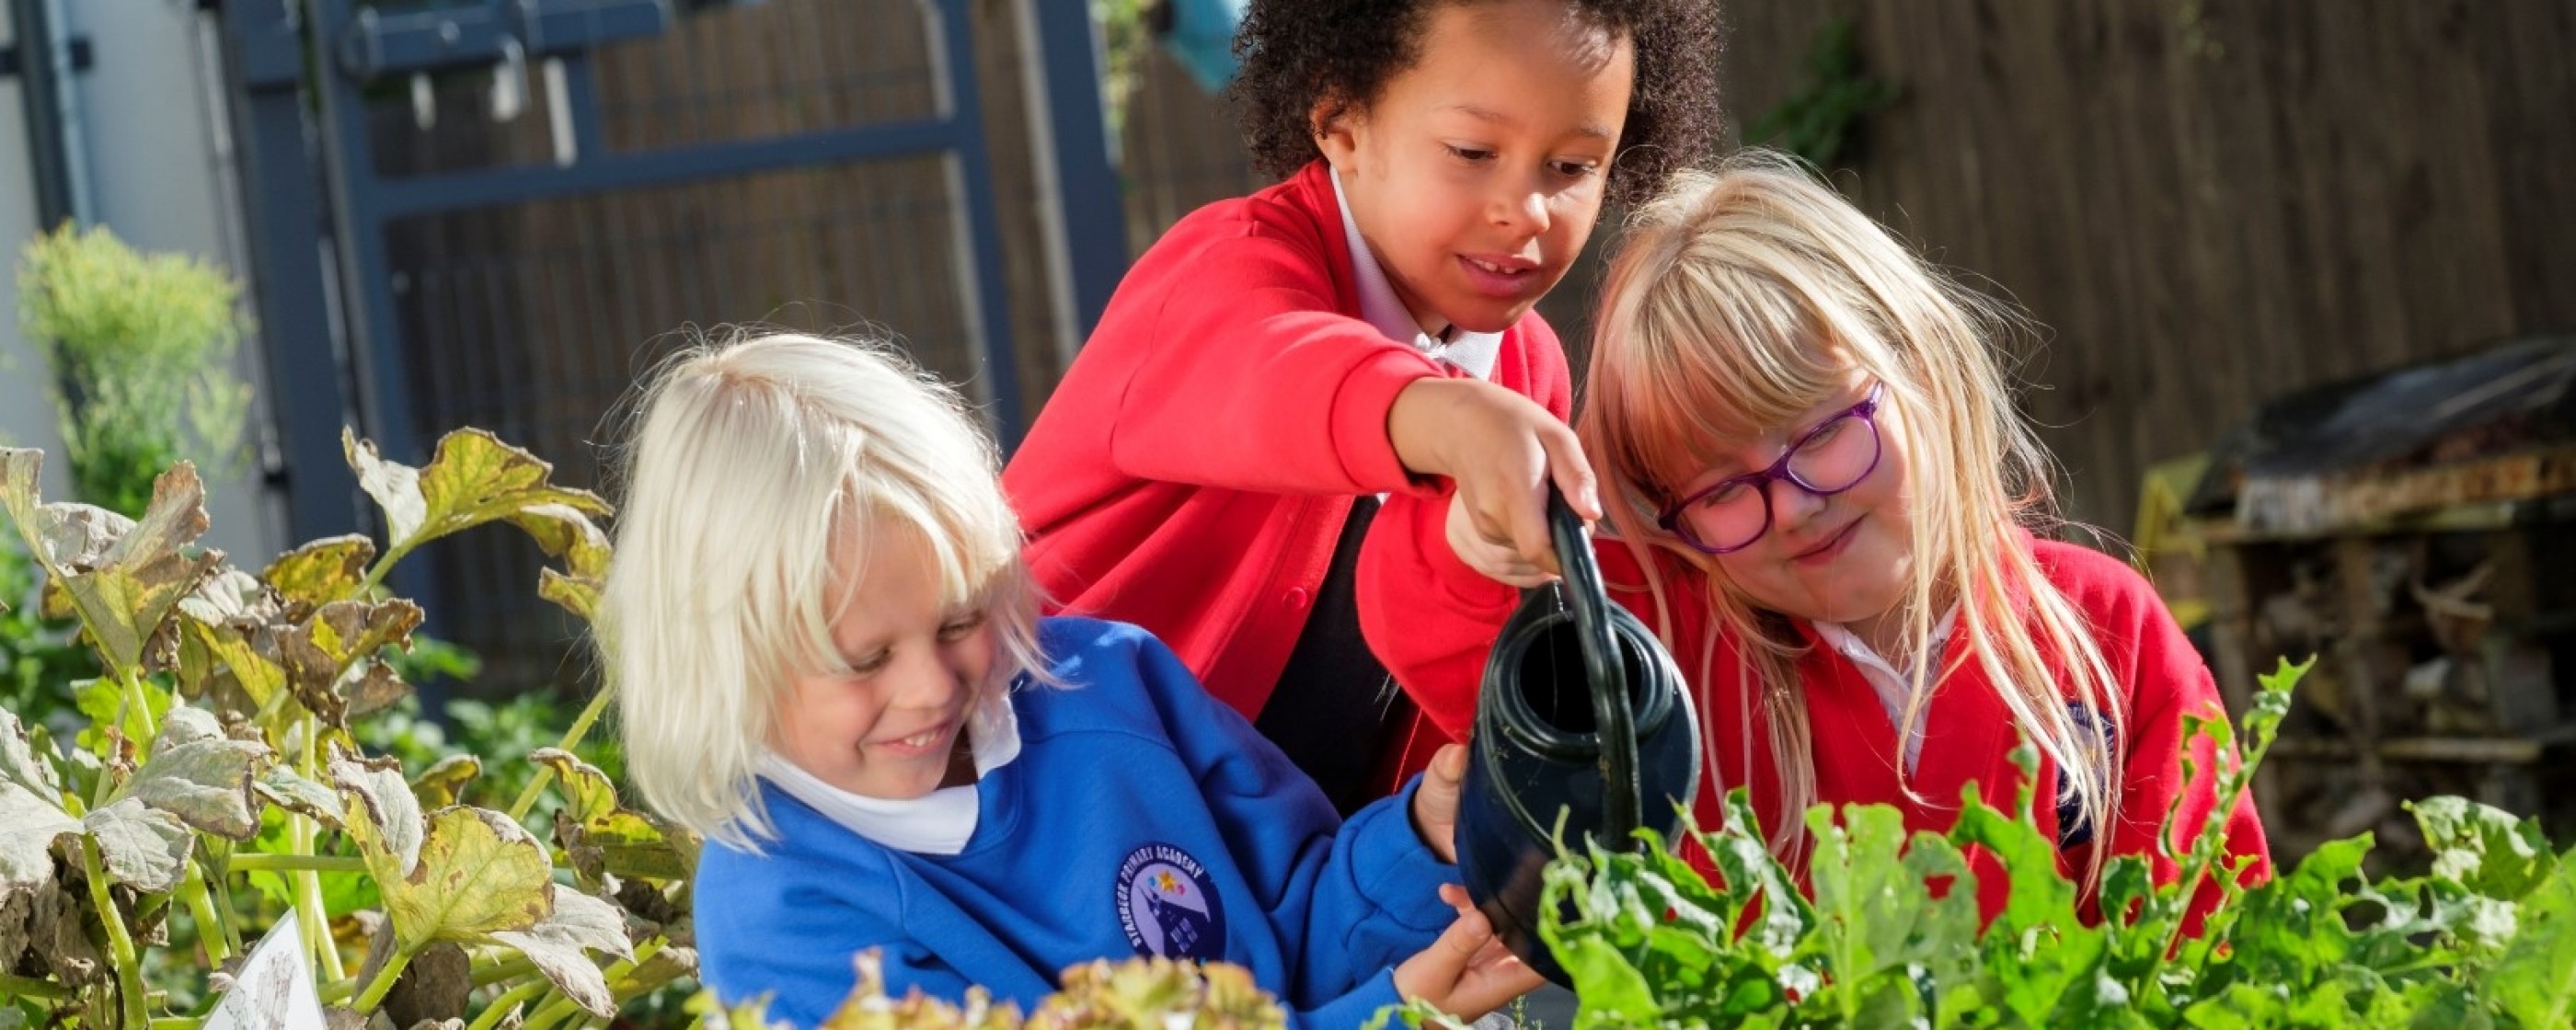
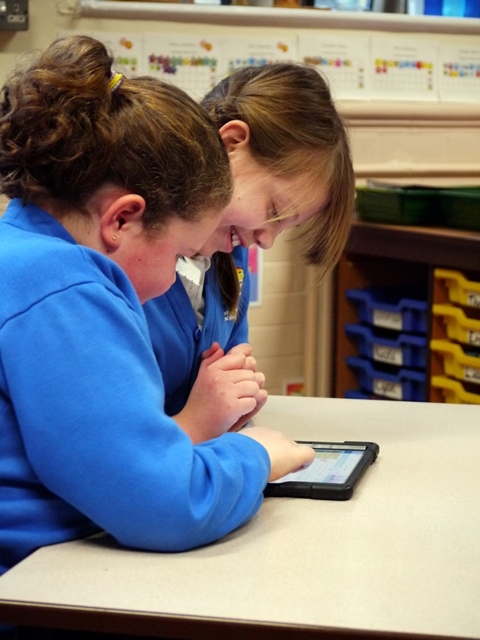
Welcome to Starbeck...
Starbeck Primary Academy
Headteacher: Mr Garry de Castro-Morland

View the Northern Star Academies
![]()
Northern Star Academies Trust is a thriving Multi Academy Trust in the North of England, comprising of 9 schools – a charitable Trust focusing on the public advancement of education for the public benefit.
Our academies
View accreditations
![]()
Starbeck Primary Academy,
High Street,
Starbeck, Harrogate,
North Yorkshire,
HG2 7LL
01423 884780
![]()
Northern Star Academies Trust is a thriving Multi Academy Trust in the North of England, comprising of 9 schools – a charitable Trust focusing on the public advancement of education for the public benefit.
Website: www.nsat.org.uk
Quick links
Starbeck Primary Academy is operated by Northern Star Academies Trust, an exempt charity regulated by the Secretary of State for Education. It is a company limited by guarantee registered in England and Wales (company number 07553531), whose registered office is at 77 Gargrave Road, Skipton, North Yorkshire, BD23 1QN (where a list of members may be inspected).